Live Seismograph: Earthquake Wave Recording & How It Works
What is a seismograph
A seismograph is an instrument that detects and records seismic waves produced by earthquakes and other ground vibrations. This page features a live seismograph display that shows real-time seismic activity and explains how seismographs capture earthquake waves, how to read the data, and why it matters for understanding earthquakes.
Seismic waves are propagating vibrations that carry energy from the source of an earthquake outward in all directions. They travel through the interior of the Earth and can be measured with sensitive detectors called seismographs. Scientists have seismographs set up all over the world to track the movement of the Earth's crust.
Seismic waves are divided into two types: body waves and surface waves.
Body waves include P (compressional or primary) waves and S (transverse or secondary) waves. An earthquake radiates P and S waves in all directions and the interaction of the P and S waves with the Earth's surface and shallow structure produces surface waves. Near an earthquake the shaking is large and dominated by shear-waves and short-period surface waves. These are the waves that do the most damage to our buildings, highways, etc.
Interactive seismograph simulator
Explore how earthquakes are recorded with our interactive seismograph simulator. Adjust earthquake magnitude and distance to see real-time P-wave and S-wave motion, just like a real seismic event captured by monitoring stations.
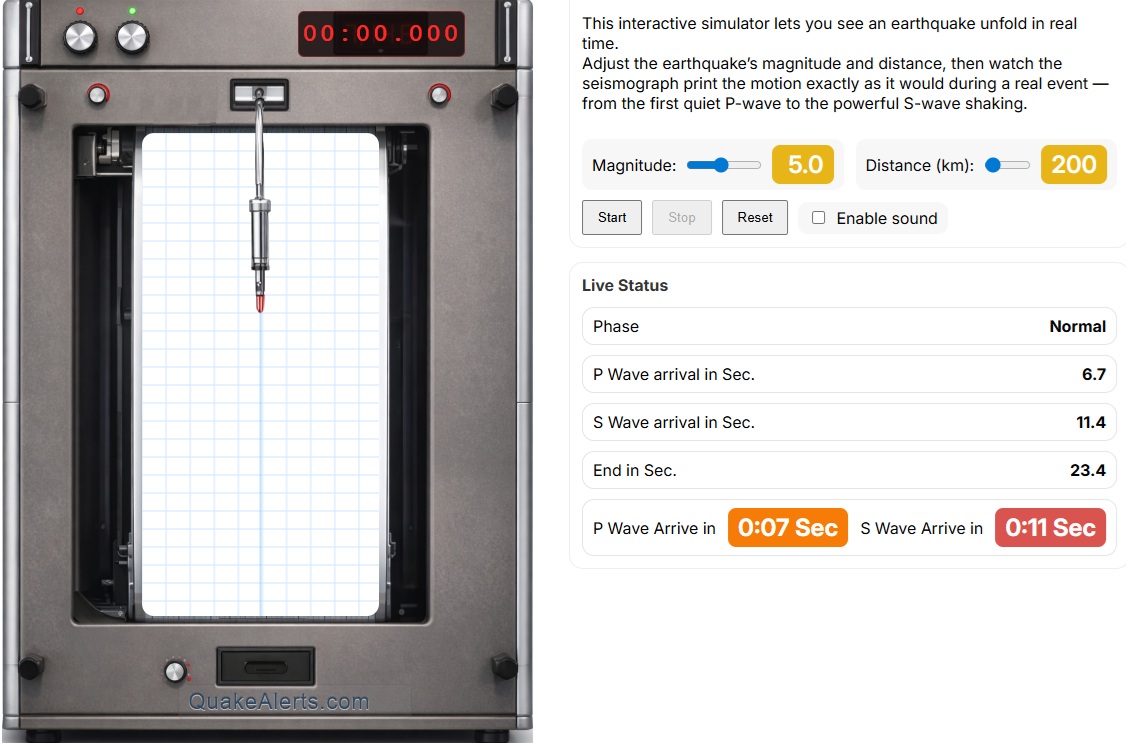
At farther distances the amplitude of the seismic waves decreases as the energy released by the earthquake spreads throughout a larger volume of Earth. Also with increasing distance from the earthquake, the waves are separated apart in time and dispersed because P, S, and surface waves travel at different speeds.
Love waves and Rayleigh waves are surface waves. Love waves are transverse waves that vibrate the ground in the horizontal direction perpendicular to the direction that the waves are travelling. They are recorded on seismometers that measure the horizontal ground motion.
Rayleigh waves are the slowest of all the seismic wave types and in some ways the most complicated. Like Love waves they are dispersive so the particular speed at which they travel depends on the wave period and the near-surface geologic structure, and they also decrease in amplitude with depth. Typical speeds for Rayleigh waves are on the order of 1 to 5 km/s.
Generally, a seismograph consists of a mass attached to a fixed base. During an earthquake, the base moves and the mass does not. The motion of the base with respect to the mass is commonly transformed into an electrical voltage. The electrical voltage is recorded on paper, magnetic tape, or another recording medium. The record written by a seismograph in response to ground motions produced by an earthquake or other ground-motion sources is called seismogram.
How does a seismograph work?
Seismographs record a zig-zag trace that shows the varying amplitude of ground oscillations beneath the instrument. This record is proportional to the motion of the seismometer mass relative to the earth, but it can be mathematically converted to a record of the absolute motion of the ground. These are examples on how seismographs work. Nowadays they are much more modern but the physical principles are the same:
The magnitude of an earthquake is determined by readings of the seismic waves resulting from the vibrations generated by the seismic source. Sensitive seismographs, which greatly magnify these ground motions, can detect strong earthquakes from sources anywhere in the world. The time, locations, and magnitude of an earthquake can be determined from the data recorded by seismograph stations.
What Can You Learn from a Seismograph?
By reading seismograms, scientists can estimate the strength, location, and depth of an earthquake. Seismographs also help distinguish between types of seismic waves and are essential for earthquake monitoring and early warning systems.
Frequently Asked Questions About Seismographs
What is a seismograph?
A seismograph is a device that records vibrations of the ground caused by earthquakes and other seismic events.
How does a seismograph work?
It works by measuring the relative motion between a suspended weight and the ground during seismic activity.
What is a seismogram?
A seismogram is the visual record produced by a seismograph that shows the amplitude of seismic waves over time.
Why is seismograph data important?
Seismograph data helps scientists locate earthquakes, measure magnitude, and understand Earth’s internal structure.
For You and Your Loved Ones
With preparedness and safety measures, protect yourself and your family from earthquake risks.
Always good to prepare for an earthquake
Earthquake Warnings are a Game Changer
Stay protected, anytime, anywhere
HAPPY CLIENTS
ALERTS DELIVERED SINCE 2011